Houston’s High Injury Network
The High Injury Network (HIN) represents 58% of traffic deaths and serious injuries occurring on 9% of Houston streets.
Each year thousands of Houstonians are injured and killed while walking and rolling. We have a public health crisis from car violence but we do not recognize it. To understand the extent of the problem and where it’s happening we need data like the High Injury Map.
In addition, most of the HIN corridors are located in Houston’s neighborhoods which are the most socially vulnerable as measured by key factors such as
poverty
lack of access to a car
housing density
race
disability
age
In March of 2024, Houston’s new Mayor announced that data such as the HIN was no longer useful. Since taking office, the Mayor has cancelled, paused or radically changed several safety improvement projects which had been designed, funded and approved on the basis of data such as the HIN.
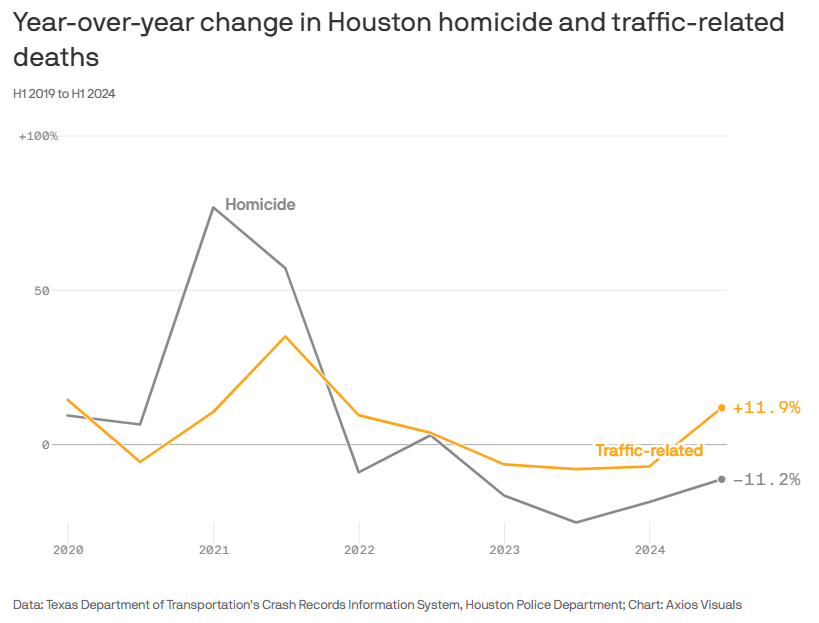
In September of 2024, Axios reported that more Houstonians die from traffic crashes than by homicide. The Mayor dismissed this data as “spurious”.
For the second year in a row, fatalities from car crashes exceed murders in Houston. From Houston Public Media: Violent Crime in Houston is Down in 2026 as Traffic Fatalities Outpace Murders.
Houstonians Lost to Car Violence
Data compiled by Bryan Dotson


Where are Houston’s deadliest crashes? Search the Houston Chronicle’s interactive map:
In the News
Violent Crime in Houston is Down in 2026 as Traffic Fatalities Outpace Murders
More Die in Houston Traffic Crashes than by Homicide
Join Farm&City in Supporting the Texas “Crash Not Accident” Bill - HB 2190
Bill 2190 - Crash Not Accident Signed into Law and Effective as of 09/01/23